User manual - Step by Step
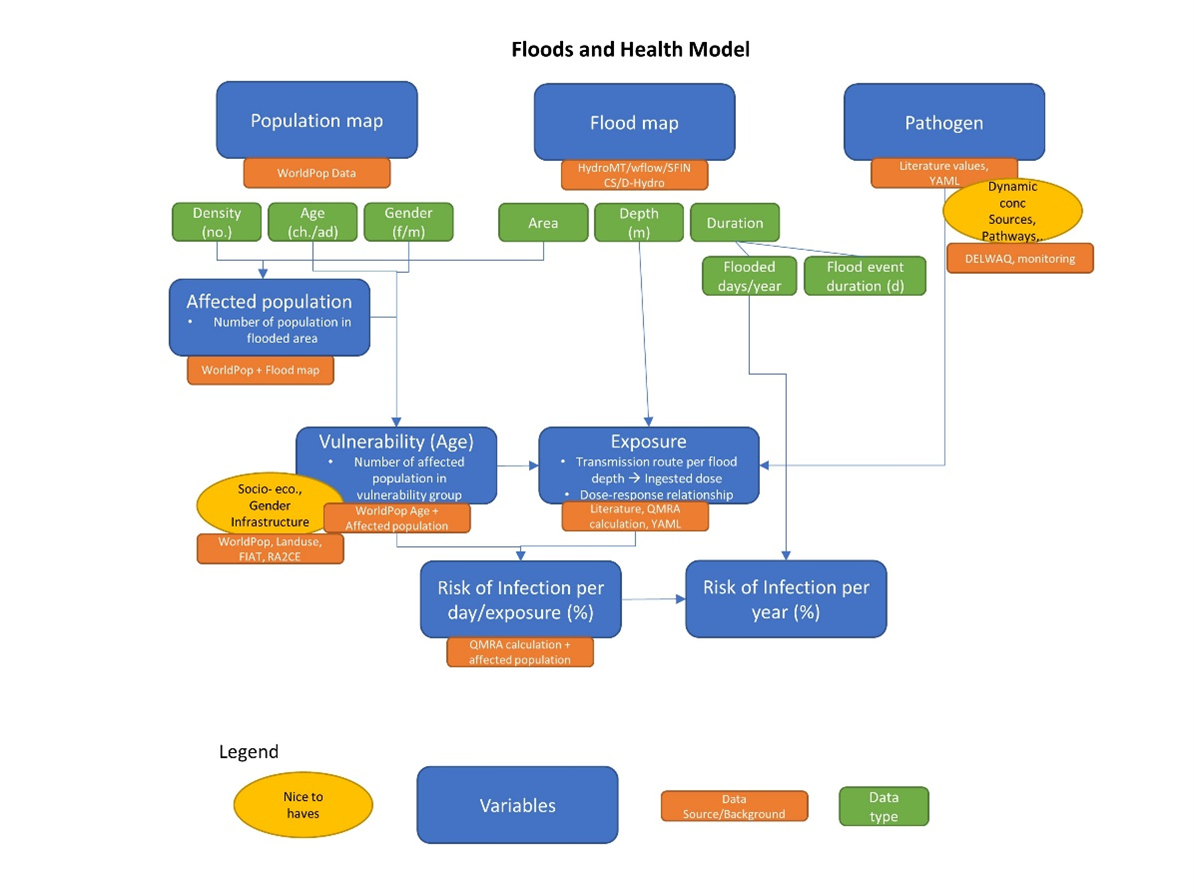
The Floods and Health tool uses flood maps produced by SFINCS and WFLOW as part of the HydroMT package, as well as demographic data from the WorldPop Database (https://hub.worldpop.org/) and transforms them into the requested format for the health assessment (.netcdf). The input data includes the severity (depth, area), as well as demographic information about the affected population (population density, age(adults, children)). Additionally, concentrations of different pathogens in floodwater (E.coli, V.cholerae, Cryptosporidium spp.) and exposure scenario’s of adults and children are provided in two separate YAML files. These files can be configurated by the user to adjust the pathogen concentrations or ingested volumes per exposure group.
For more information regarding specific parameters see the pages ‘Input parameters’ or ‘Output parameters’.
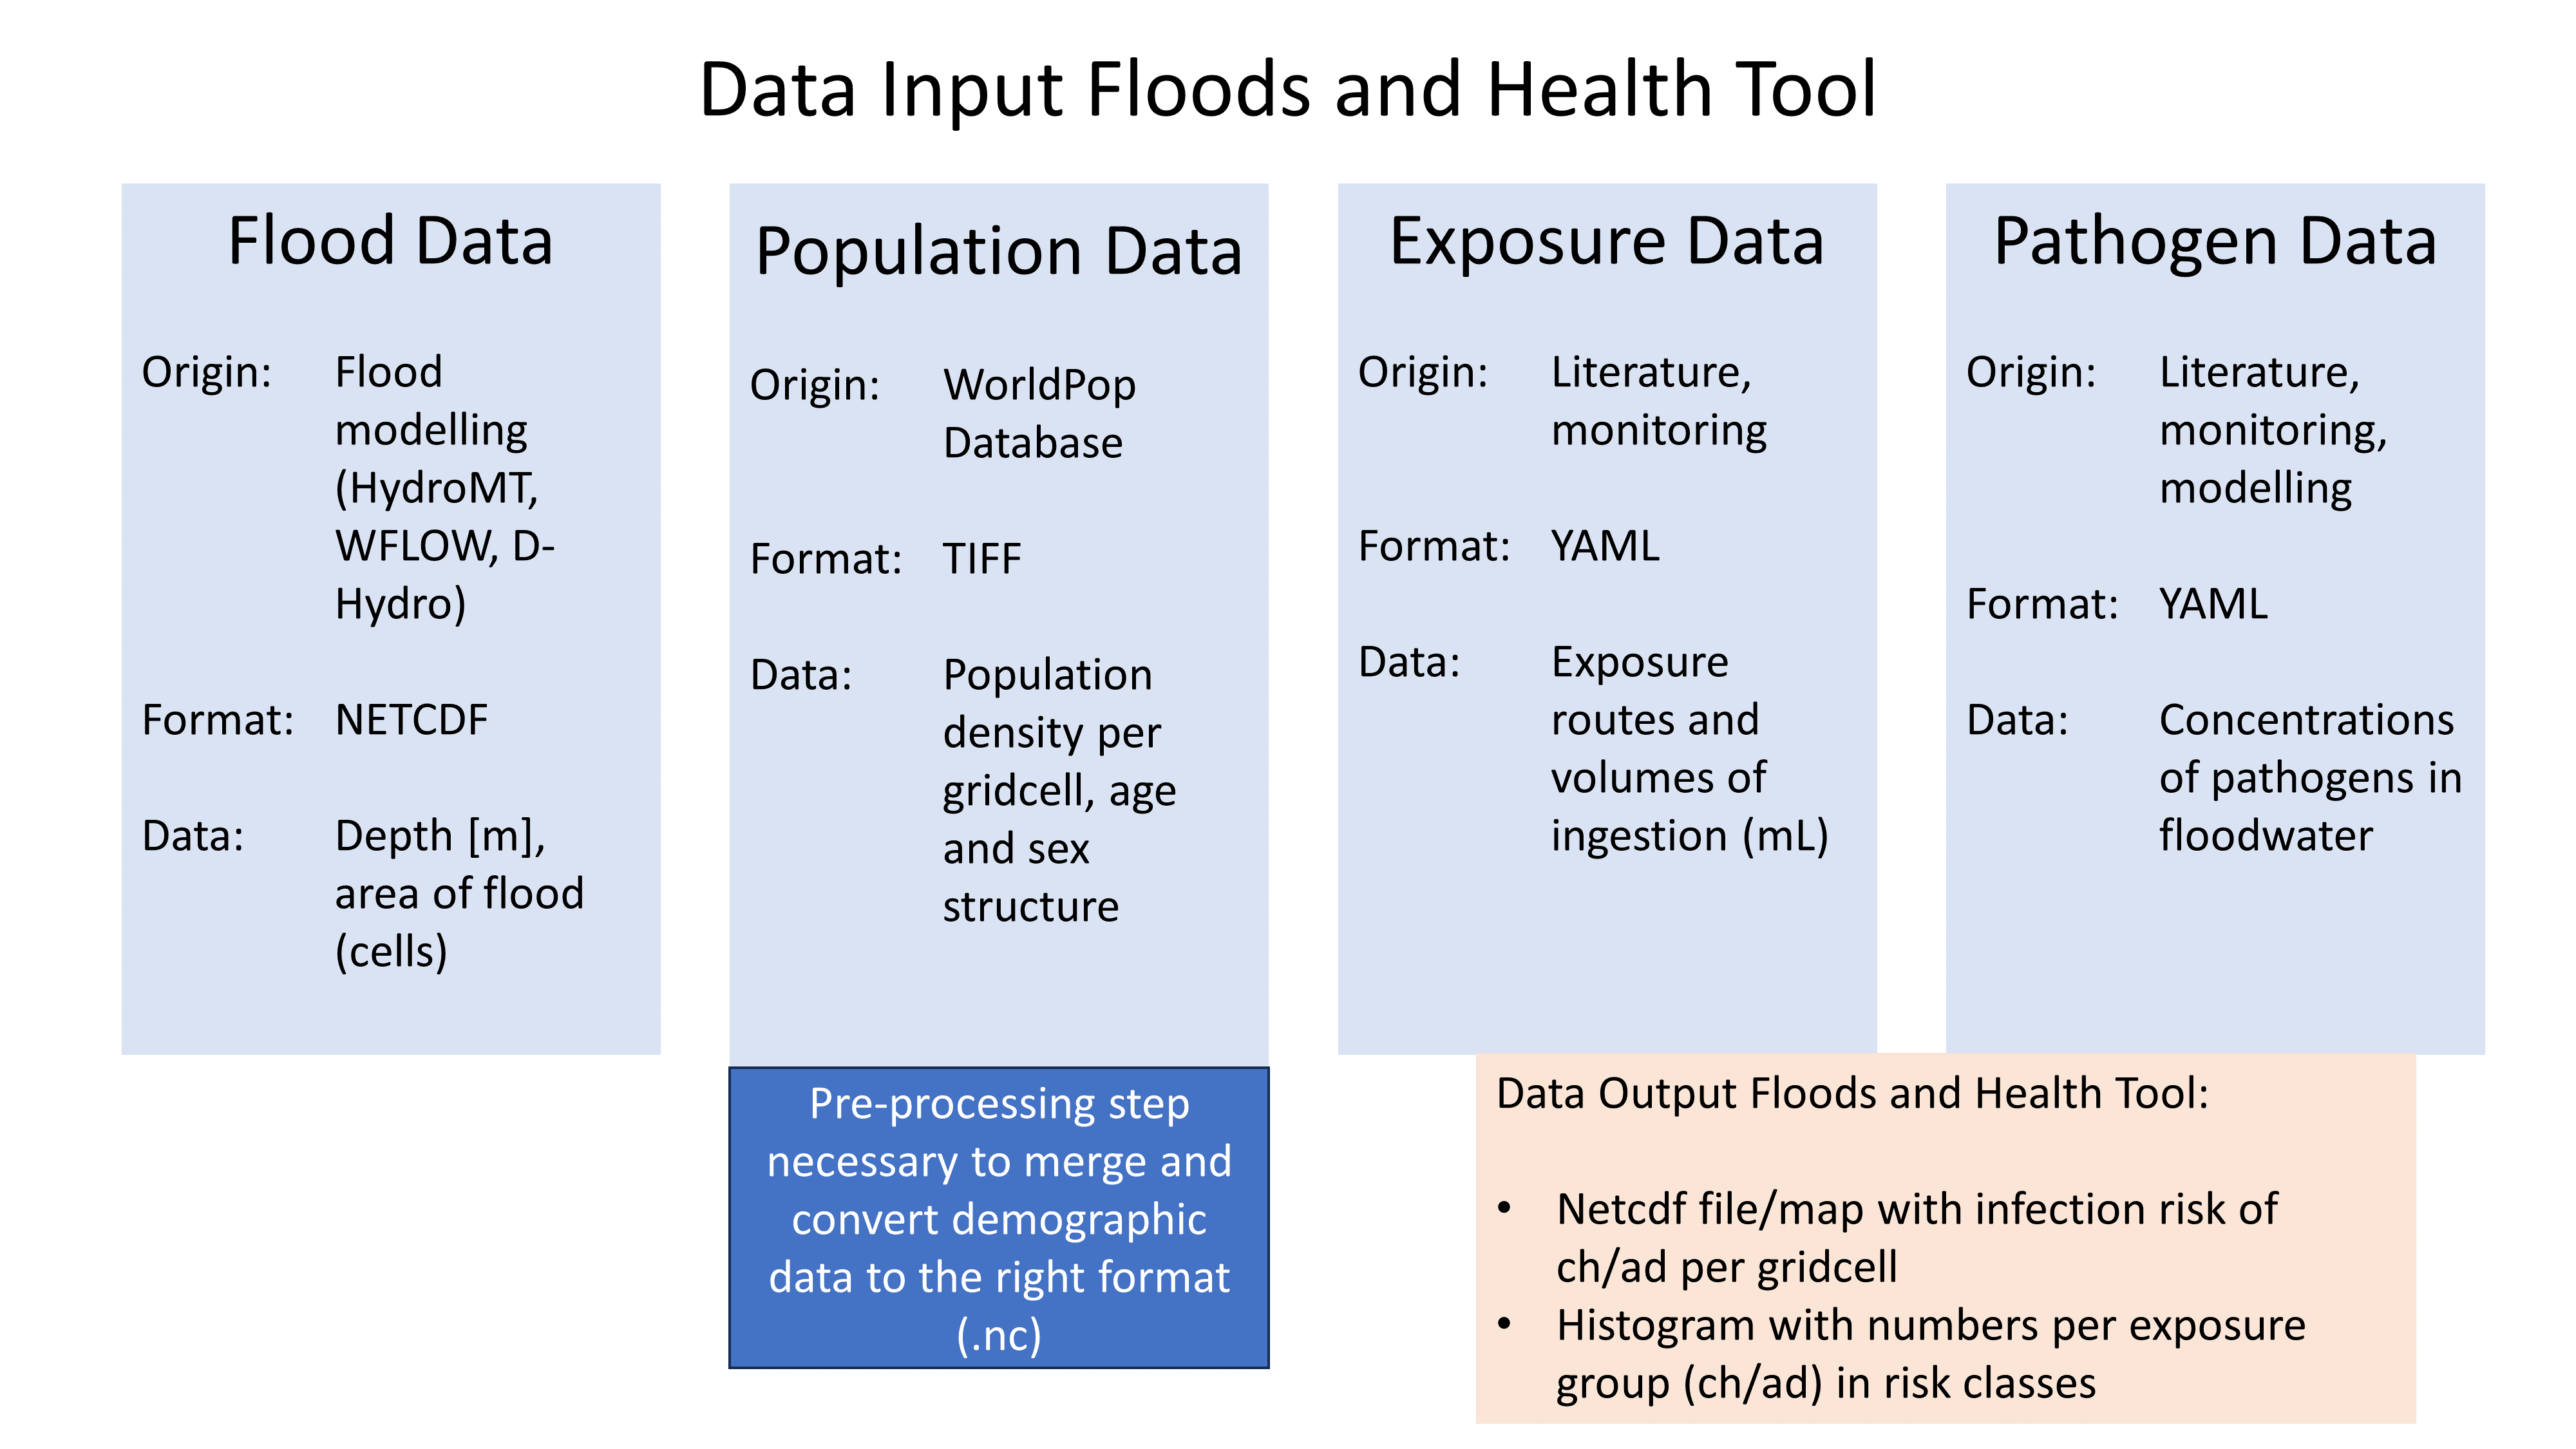
Overview of the data stream with input data, source and type, as well as potential nice-to-haves.
Pre-processing
Flood Data
To pre-process the flood data, user defined settings can be adjusted to define the origin, coordinates for the bounding box and statistics of the flood map.
#### User defined settings ####

# set scenario name
Fname = 'Scenario_1'

# select origin of flood map -> 1 = selected
Dhydro = 0
Sfincs = 1

# set location of the original flood map
mapsDir = '../examples/'           # location of the original flood map
nameFM = 'sfincs_beira_map.nc'     # name of the original flood map

# set bounding box
BB = 1 # 1 = bounding box, 0 = full map

if BB == 1:
 # set bounding box coordinates
xmin = 0.66e6
 xmax = 0.71e6
ymin = 7.79e6
ymax = 7.84e6

# Set the required flood map stats for QMRA analysis
FloodArea = 1
FloodMax  = 0
FloodDur  = 0
FloodNr   = 0

# if FloodArea = 1, choose the timestep, other options create a one time step output
timestep = 10
Demographic data
To use the population density data and age data from the WorldPop Database, the data needs to be merged and the population density data reprojected. Further, they are converted to netcdf format.
Preparation Steps for the Script:

1. Download Age Data of the country of interest from https://hub.worldpop.org/geodata/listing?id=88
2. Make two different folders for Children (0-10 years) and Adults (>10 years)
3. Download the Population density map of the country of interest from https://hub.worldpop.org/geodata/listing?id=76

There should be two input folders (1. adults and 2. children) containing the different tif files of adult and children population and one single file
with the overall population density.

All files are in TIF format and will be converted to NETCDF ultimately.
Grid characteristics
projection      = EPSG:4326 - WGS 84
y0              =
mmax            =
nmax            =
dx              =
dy              =
rotation        =
Input format
inputformat main script = net
Output format
The main map output is in netcdf.
outputformat = net
Output files
In case of netcdf output the map output will be named ‘’, in case observation points are provided also a second file will be created with observation point output named ‘’.
For more information about the variables saved to the netcdf output files, see the ‘Output description’ section.
QMRA parameters
The user needs to define the desired pathogen, source, concentration, dose-response relationship and values for the equation as indicated below.
# User defined settings for pathogen and scenario selection

pathogen = 'E.coli' # select the pathogen for the simulation. Option at the moment is only 'E.coli'
source = 'Sewer_and_pluvial' #select the source of the pathogen. At the moment only 'Sewer_and_pluvial'
conc = 'max' #select the concentration of the pathogen: options are 'min' and 'max'
doseresp = 'poisson' #select the dose response curve of the pathogen for infection calculation. Either 'beta poisson' (keyword: 'poisson') or exponantial       ('exp', not yet included)

#form values for poisson distribution
N50 = 896 #constant for the beta poisson infection risk calculation
NoE  = 4  #number of events per year
alpha = 0.145 #form value for poisson distribution
Pathogen concentration
Pathogen concentrations are available as default in YML file for different scenario’s based on literature values.
pathogens:
- name: E.coli
scenarios:
- name: Scenario 1
min_conc: 1000
max_conc: 100000
source: Sewer_and_pluvial
units: MPN/ml
- name: Scenario 2
min_conc: 0
max_conc: 1840
source: Fluvial_and_sewerinflow
units: MPN/ml
- name: Scenario 3
min_conc: 870
max_conc: 1080000
source: Sewer
units: CFU/ml

- name: Campylobacter
scenarios:
- name: Scenario 1
min_conc: 0.014
max_conc: 1
source: Sewer
units: MPN/ml
- name: Scenario 2
min_conc: 23
max_conc: 240
source: Sewer
units: CFU/ml

- name: Enterococci
scenarios:
- name: Scenario 1
min_conc: 100000
max_conc: 1000000
source: Sewer_and_pluvial
units: CFU/ml
- name: Scenario 2
min_conc: 5000
max_conc: 37000
source: Sewer
units: CFU/ml

- name: Cryptosporidium
scenarios:
- name: Scenario 1
min_conc: 10
max_conc: 15
source: Sewer
units: oocysts/L
- name: Scenario 2
min_conc: 0.1
max_conc: 10
source: Sewer
units: oocysts/L

- name: Giardia
scenarios:
- name: Scenario 1
min_conc: 0.1
max_conc: 10000
source: Sewer
units: oocysts/L
Exposure Scenario’s
Exposure scenario’s and ingested volumes are based on the flood depth and age of the population.
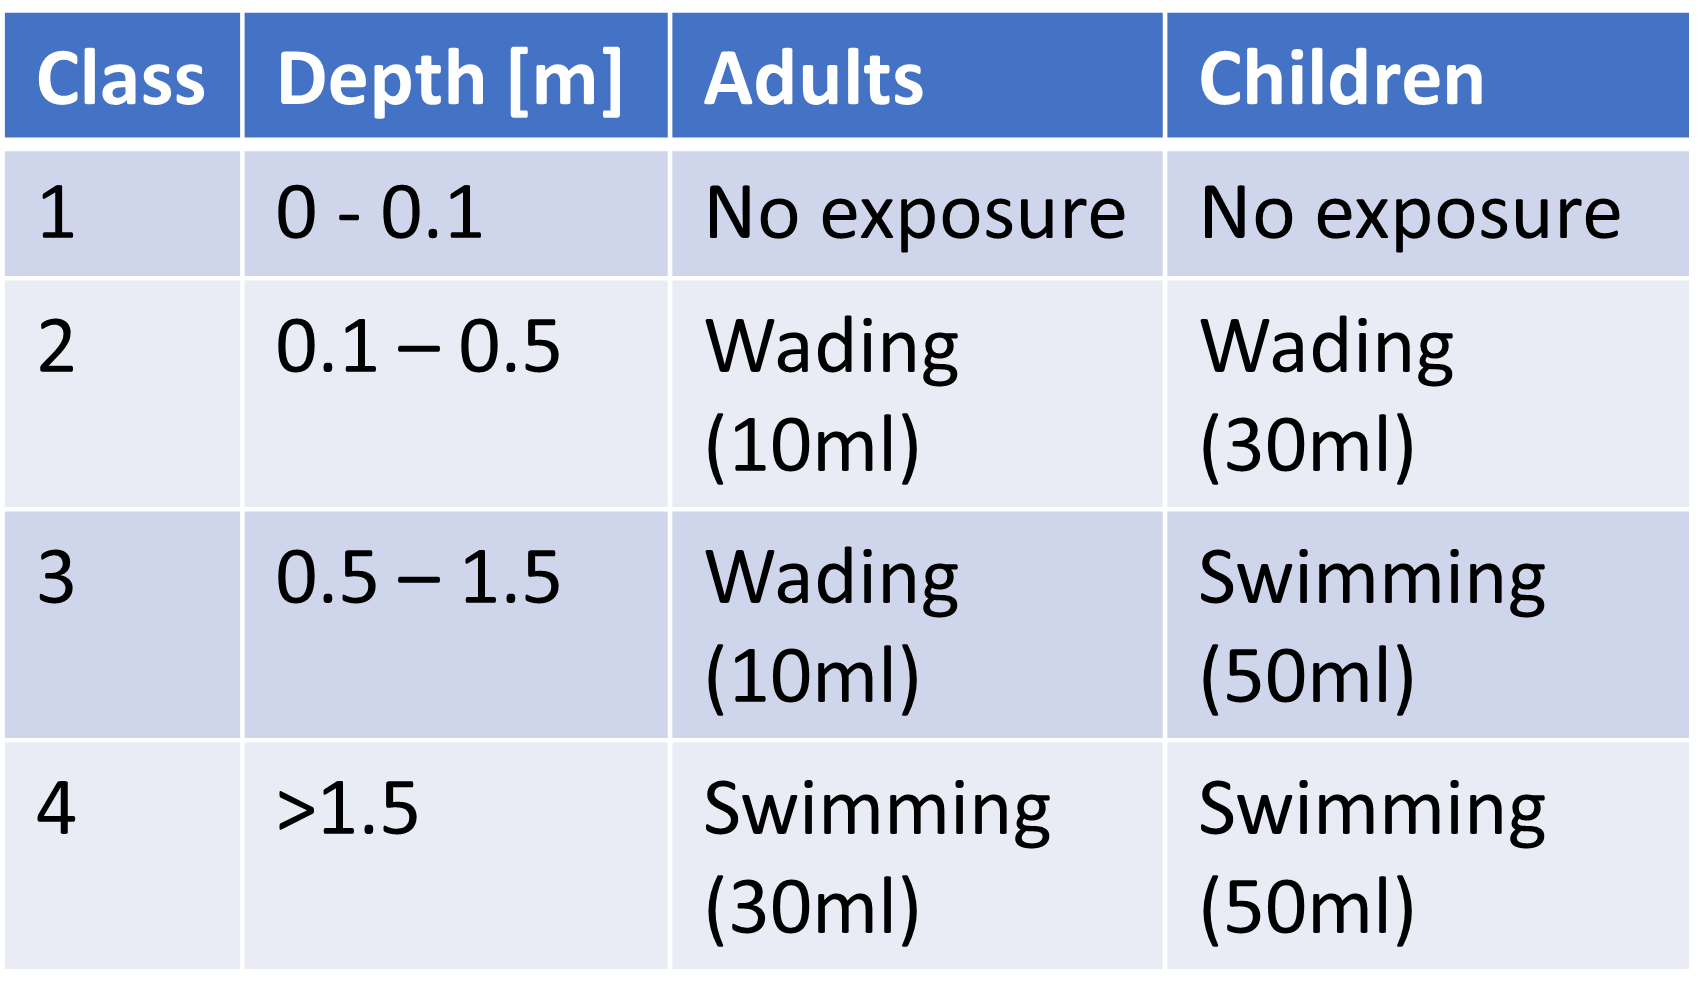
The default values for the ingested volumes are default values in a YML file based on literature.
-Splashed_Adult:
unit: ml/event
conc: 10

-Wading_Adult:
unit: ml/event
conc: 10

-Swimming_Adult:
unit: ml/h
conc: 3.5

-Playing_Children:
unit: ml/d
conc: 30

-Swimming_Children:
unit: ml/h
conc: 50
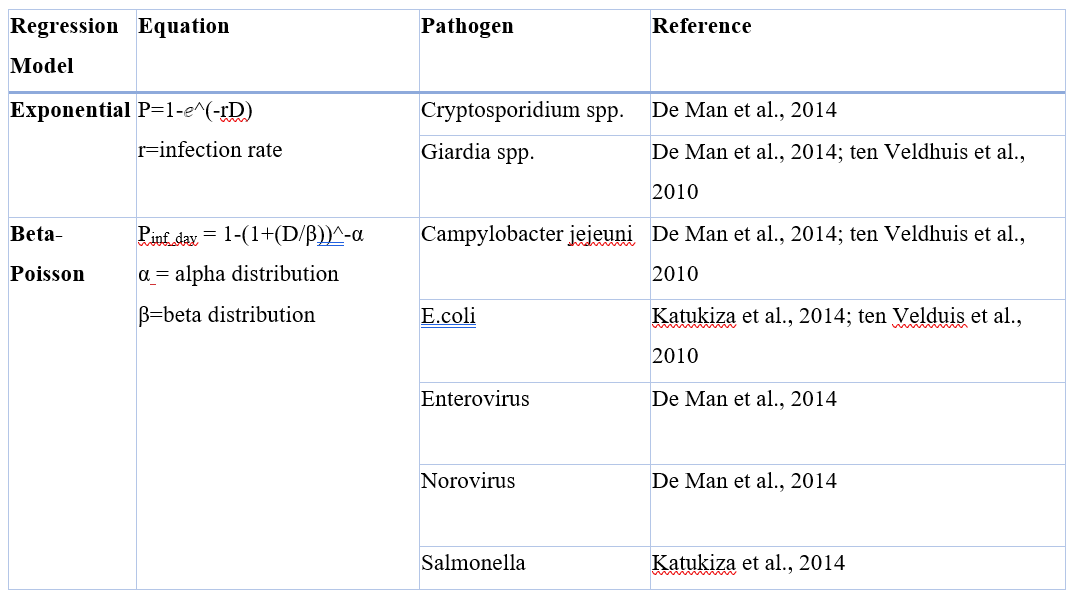
Dose-Response-Relationship
Based on the specific pathogen, the user needs to choose the calculation method and the necessary parameter from literature.
Output - QMRA calculation
The output of the QMRA calculation are two maps (.netcdf) of the flood area, indicating the infection risk for children and adults. Furthermore, a histogram is saved to the output folder, showing the number of children and adults in different risk classes.